

Currently Empty: $0
Survey Results
Each quarter SWPP surveys the workforce planning community on critical workforce planning topics. Over 140 call center professionals representing a wide variety of industries participated and provided insight into this quarter’s survey on forecasting workload.
Survey Participants
The participants in the survey work in centers with a wide variety of agent sizes. Over 40% are from organizations that have between 50–500 agents, while 21% have 1000–5000 agents, and 13% have over 5,000 agents. The financial, heath care, and insurance industries drew the largest number of participants, but all other industries are also well represented.
Forecasting To Determine Staffing Requirements
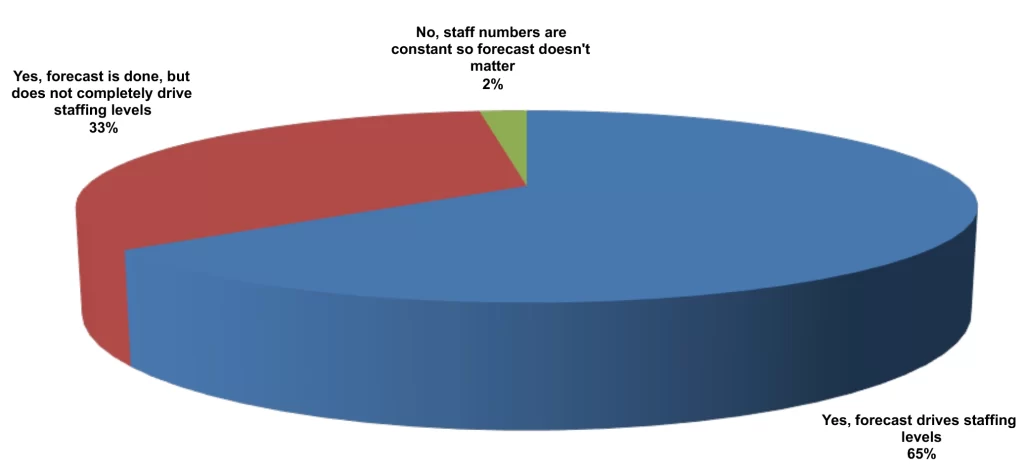
Respondents were asked if their forecast serves as the basis of their staffing plan. Sixty–five percent of respondents indicated that their forecast determines staffing levels, while 33% indicated that it plays a role but is not the sole determinant. The remaining 2% have set staffing numbers, so the forecast does not matter when it comes to determining staffing plans.
Forecasting Responsibility
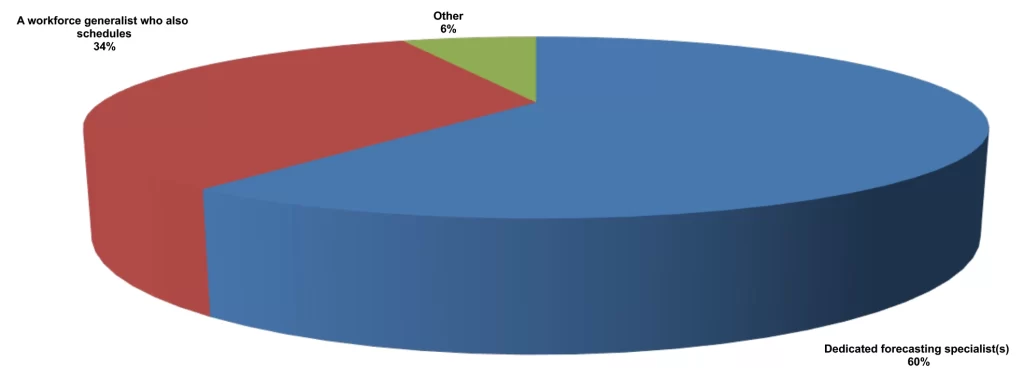
When asked who is responsible for the forecasting process, 60% indicated that there is a dedicated forecasting specialist. This tracks closely with the 65% who use the forecast to determine staffing levels. Where the forecast is not the sole determinant, a WFM generalist appears to be responsible and that tracks with the 33% who use the forecast along with other information to make their staffing plans. However, there may not be a significant correlation and other factors such as size of operation may be more relevant.
Tools Used for Forecasting
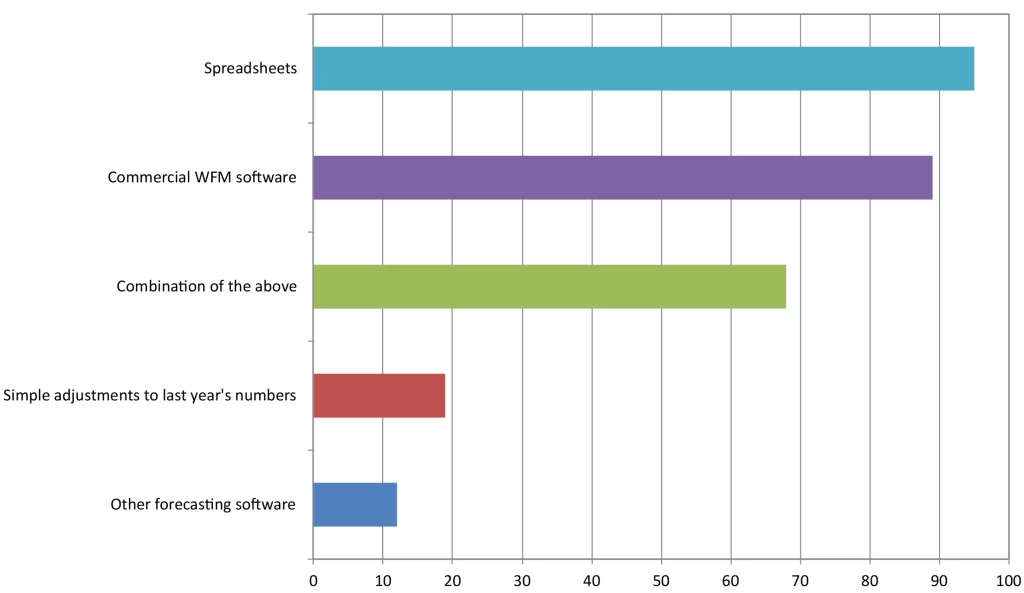
The respondents were asked how they accomplish the forecasting process and multiple selections were allowed. Over 90 of the respondents use a spreadsheet but just under 90 use commercial WFM software. Approximately 65 indicated that they use a combination of these tools. The responses suggest some confusion about the options with more using a combination of tools rather than a single tool. Less than 20 indicated that they adjust last year’s numbers, with 12 indicating the use of some other forecasting software than the commercially available tools.
Forecasting Models
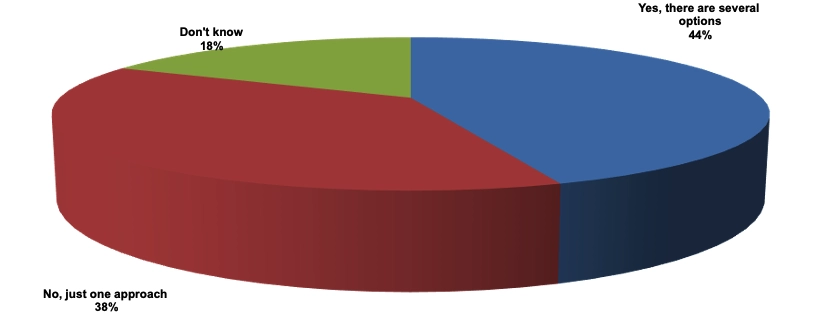
The respondents who use commercial software were asked if they have a choice of forecasting models. While 18% of respondents indicated that they didn’t know if there was a choice available, 44% indicated that they had several modeling options. However, 38% indicated that there is only one model available in their tool.
Where the forecast covers only incoming telephone calls, a single model may be adequate. However, as centers take on chat, email, back office, and other work, the standard model for voice may not be sufficient. Even the use of skill–based routing for incoming calls can render a simple model inadequate.
Understanding of the Forecasting Algorithm
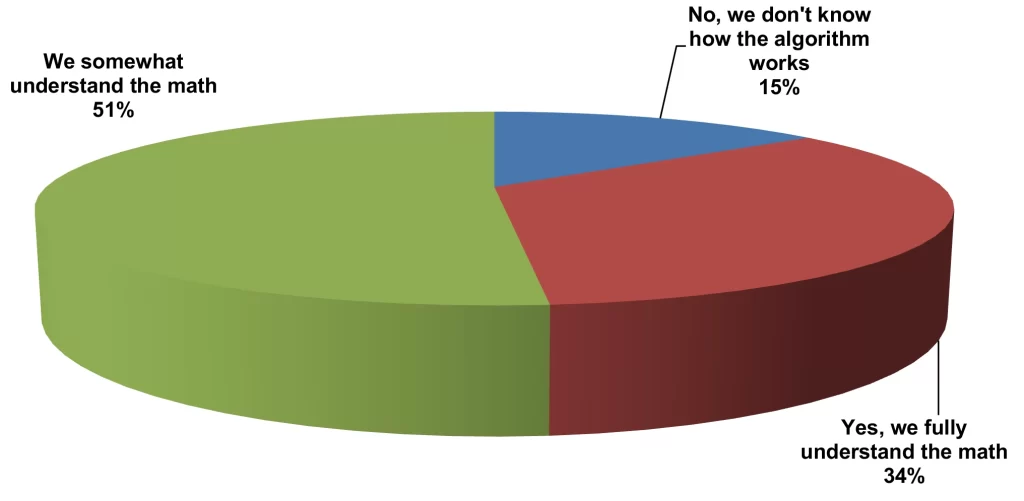
Respondents were asked if they understood the mechanics of the forecasting algorithm used in their operations. Thirty-four percent of the respondents indicated that they do fully understand the math used. However, a little over half indicated that they only somewhat understand the math. Fifteen percent indicated that they do not understand how the algorithm works.
As the tools and their various optional algorithms grow more sophisticated to address the new types of work being done in the centers, understanding the options enough to make the best choice model for each work will be critical to the accuracy of the forecast and resulting staffing plans.
Major Forecast Drivers
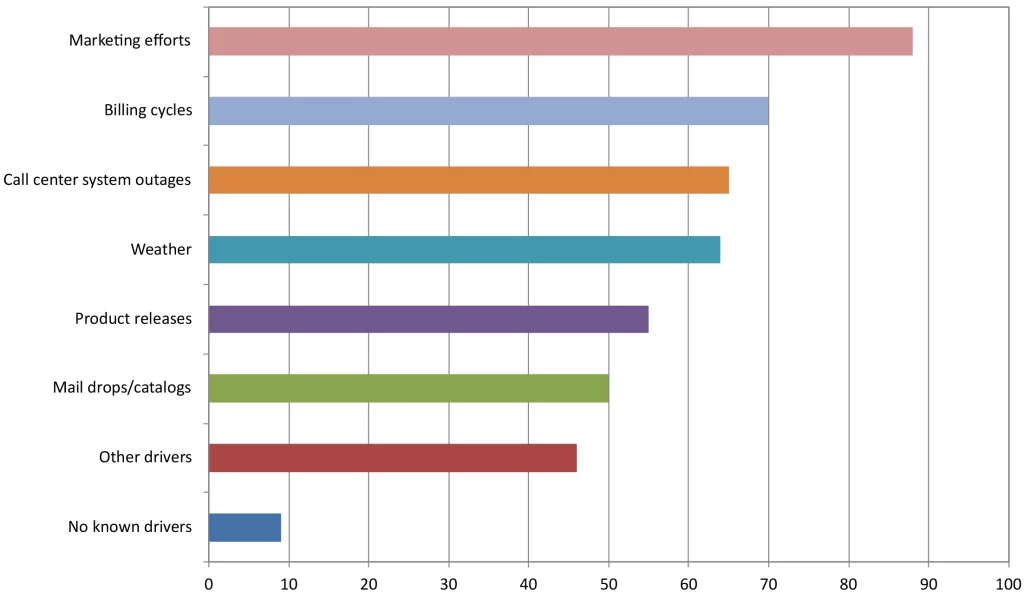
Respondents were asked to select from the offered choices to indicate what drives their forecast. Multiple selections were allowed. Marketing efforts drew the largest number of answers with billing cycles close behind. A surprising number selected call center system outages as a major driver. Reliability of the IT systems is critical to the operation in delivering the work to the agents and supporting their efforts to process that work. A chronic situation of system failures would benefit from attention from the senior management team.
Forecast Frequency
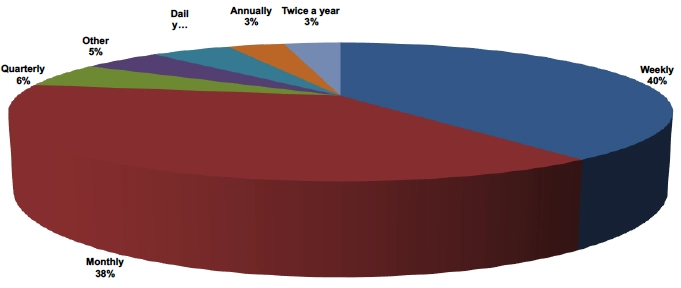
Respondents were asked how frequently they produce a new forecast. Monthly (40%) and weekly (38%) were chosen most often, with daily indicated by only 5%. The frequency of forecasting is largely driven by the volatility of the workload and the intensity of the desire to match staffing to deliver consistent service. It is also dependent upon the ability of the center to vary the staffing to match the forecast requirements. Where staffing levels are set and do not vary, there is little benefit to frequent forecasting.
Measuring Forecasting Accuracy
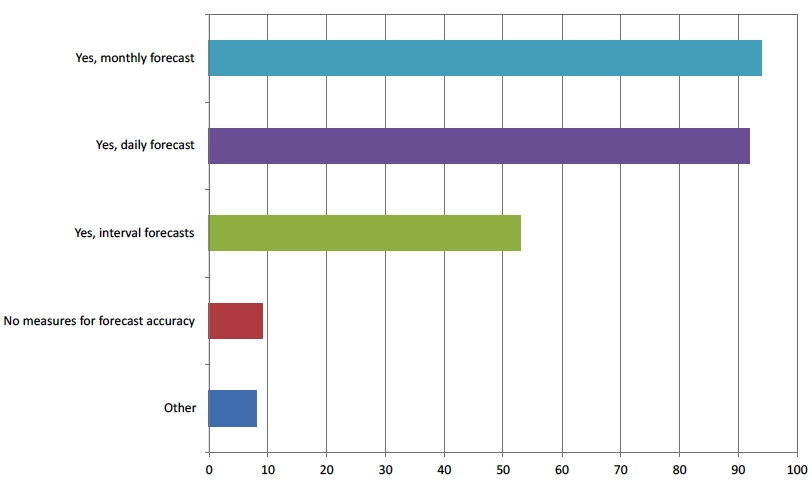
Respondents were asked how they measure forecasting accuracy and multiple choices were allowed. Monthly and daily comparison of actual to forecast were both selected by over 90 of the respondents. Just over 50 selected that interval accuracy is measured. Less than 10 indicated that they do not measure accuracy of their forecast.
Given that errors in the forecast can drive a shortage or excess of staffing, accuracy is the key to efficiency. Beware of the deception of averages over a long period. Even the different hours within a day can have significant errors in both directions that might average out to a reasonably close result for the day. Looking at the interval level can better support analysis of the reasons for consistent errors so that improvements can be made.
Biggest Challenge for Accurate Forecasts
Respondents were asked what the biggest challenges to accurate forecasting in their operation are. Some of the most common answers are listed below:
Not having the technology that supports the forecasting process for such things as multi-skill and sophisticated models for new work types
- Lack of communication with departments that drive workload
- Understanding concurrency in chat workload
- System outages
- Unplanned shrinkage
- Managing large numbers of queues and businesses
- Inadequate historical data
- Volatile weather patterns
- Complex skilling environment
- Lack of well-trained staff to utilize WFM software capabilities
- Software limitations such as using a single shrinkage across all time periods
- Lack of data for back-office functions
- External factors such as legislation, tariffs, etc.
Closing Comments
Based on the responses above, forecasting accurately is a challenge for many operations. While some have staffing levels that do not easily adjust to changing workload, most are trying to make an efficient match by interval, day, and week. Challenges include both internal factors such as lack of communication with departments that drive work, WFM tool limitations, system outages, and external factors such as changes in weather, legislation, tariffs, etc.
Every business has different needs and the technical capabilities to meet these appear to be lacking in many cases. Making do with limited tools and information makes the process more difficult than it needs to be. Working closely with business partners and ensuring senior management sees the value of efficient and effective staffing are keys to success.
Source: GWFM Research & Study