
Currently Empty: $0
Using R programming; from Capacity Plan To Hiring Plan
July 27, 2022

Introduction
Capacity planning involves calculations that finally tell you how many FTEs you will need in every interval. FTE is an abbreviation for ‘full-time equivalent’. In the simplest terms, an FTE hours equals the number of hours a full-time agent delivers in a specific time range. This means that FTE hours depend on the time range in question. For example, an FTE delivers 30 mins within 30 mins range and 1 hour within a 1-hour range. Anything less than that would not be an FTE. If you would like to find out more information on what an FTE is this article has more detail.
An FTE per 15/30/60 minute interval needs to be converted to daily and then weekly/monthly FTEs since the workforce schedule is usually created not for such small intervals but for a week or a month. Examples of such calculations are given below. However, the more difficult task is to convert the per interval FTEs to the number of heads that we need to hire for healthy coverage in all intervals.
As promised, let’s take a sample capacity plan output and see how to calculate the number of FTEs for various interval lengths. The code chunks are in R, but you can easily translate them to your favorite programming language.
Calculating FTEs
Let’s load the sample capacity plan file showing per interval number of FTEs for days in January 2022.


See that the number of FTEs changes from hour to hour. So how do we tell how many FTEs we need in a certain time range?
a. FTEs in the first 5 hours of January 1
Obviously, a full-timer who works in those 5 hours will work all 5 hours. Now the question is “how many such 5 hours do we have in the first 5 hours?”. Does that sound like asking for the mean? Yes!

How many FTEs on January 1?
To answer this, we need to know how many hours one full-timer works in a day. We will assume it is 8 hrs, as it is the case in most countries.

Likewise, we can find the number of daily FTEs for all days by using Colsums function.
Hide

See that FTE’s count changes across days.

The next step should be how to find out weekly FTEs.
Weekly FTE’s
Similarly, Weekly FTEs is calculated by dividing the weekly hours by the number of weekly hours of a full-time employee. Let’s assume a full-timer does 40 hours every week. These assumptions may change during holidays or partially closed weeks.

If you do not have a per interval FTE count, the weekly FTE count can be calculated from an average daily FTEs by multiplying the daily FTEs by the total of working days in a week and then dividing by the number of weekly working days for a full-time employee. For instance, the multiplier is 7/5 if full-time employees work only 5 days a week in a 7-days a week workplace.
This of course, is assuming that all the days will have a similar FTE count as the daily FTE.
January total FTEs

See that it is very similar to an average weekly FTE. It is, therefore, acceptable in most cases to use an average of weekly FTEs to find the monthly FTE count.
Does it mean that we will need only 32 heads for January? How many do we need to hire?
Schedule shells + Minimum Headcount
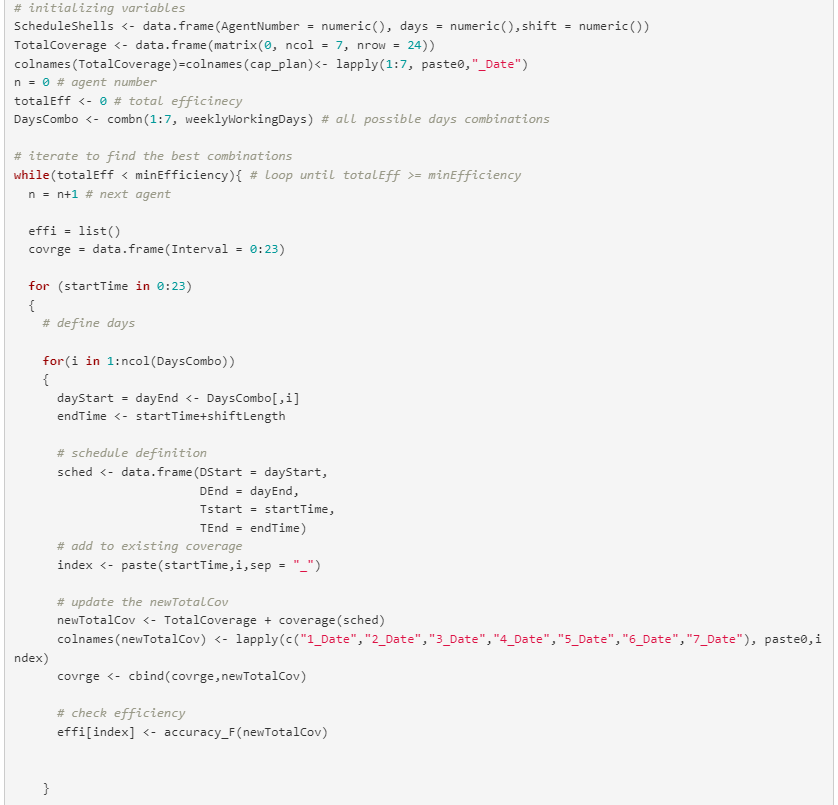
How do we figure out the minimum number of heads and the schedule per head? This is not an easy task as there are almost unlimited possible combinations of headcount and schedule formats that can achieve certain coverage. How do we search for the best combination? My algorithm I have recently worked on an algorithm that linearly searches for the optimum days of the week and shift start combination per agent starting with the first agent. It does so by calculating the efficiency of staffing for every combination and at the same time adding the combination that achieves the best efficiency to the list of shift shells. The loop continues until the desired staffing efficiency is achieved or adding more agents does not improve the efficiency anymore.
In other words, there are four important parts to the algorithm. We will work with an average weekly FTE distribution from our January FTE data.
1. Calculating the coverage the schedule is divided to separately handle the shifts running across days. The final coverage is the combination of the two. Let’s assume nobody works more than 12 hours a day, so shift end should be less than shift start if the shift crosses to the next day. This will work only if the time start and time end are in 24-hr notation. Please read my blog here to understand how to convert schedule to coverage. Function computing the coverage for a given set of schedule shells.

2. Checking the efficiency
The staffing efficiency can be calculated at 1-MAPE. MAPE is the mean absolute percentage error. The coverage is compared to the required point to point; the absolute difference is summed up and divided by the sum of FTE counts to give the MAPE value. The complement of that is what we call ‘efficiency’.
Function to check staffing efficiency in every iteration.

3. Initialization
This is where you customize the settings to your contact center’s schedule rules.

4. The loop

Let’s transform the two output tables into the long format and combine them to plot the coverage against the requirement. The necessary transformations are in the following chunk.

Results


Schedule shells

Coverage vs Requirement


The result is quite good, isn’t it? The under-staffing in some intervals is because over-staffing of some intervals to fill the gaps of the other understaffed intervals is not supported by this algorithm. If your distribution is more regular than the one applied above, you can expect better coverage than this. As you would expect, linear search is a very slow algorithm, especially on R.
Author: Tesfahun Tegene Boshe